
Those of us who lived through the 2008 ‘Great Recession’ learned some hard lessons about how the economy really works. Here I’d like to compare what actually happened with a back test utilizing the Fides Economic Model through the APCA.
What actually happened in 2008-2009?
First let’s discuss briefly what financial effects we saw during this period:
- Unemployment rose from 5% to 7.35% in 2008 and peaked at 10% in 2009
- GDP growth was -0.1% for 2008 and -2.5% during 2009
- National Debt rose $1.7T in 2008 and a further $1.9T in 2009
- CPI fell sharply throughout 2008 and shifted deflationary in 2009
- The S&P dropped sharply only to be saved by Taxpayer bailouts through debt creation
This is indicative of an economy that has positive feedback between money creation and growth. Debt spending was utilized to prop up the very institutions that had caused the crisis. This disproportionately effected where that capital was concentrated post crisis. Depending on the source, it is estimated approximately 6 million families lost their homes and 10 million Americans were displaced by that.
Over the following decade and a half, we have all seen the results, but I want to focus on two in particular. “Too Big to Fail” became our new financial reality. As so many American assets are backed by financial institutions, their ‘success’ is tied directly to our well-being. Thus it was determined that TARP was the most efficient way to ‘bail-out’ the American economy.
This put in place an implicit guarantee backing riskier industry practices, as the taxpayers would always draw the same “Too Big to Fail” conclusions. The second was the scooping up of those single family homes that had undergone foreclosure post-crisis. The new low rate environment invited capital to purchase assets that provided safety and, more importantly, returns. That brings us to the following chart and a seemingly innocuous tax code change in 1986.
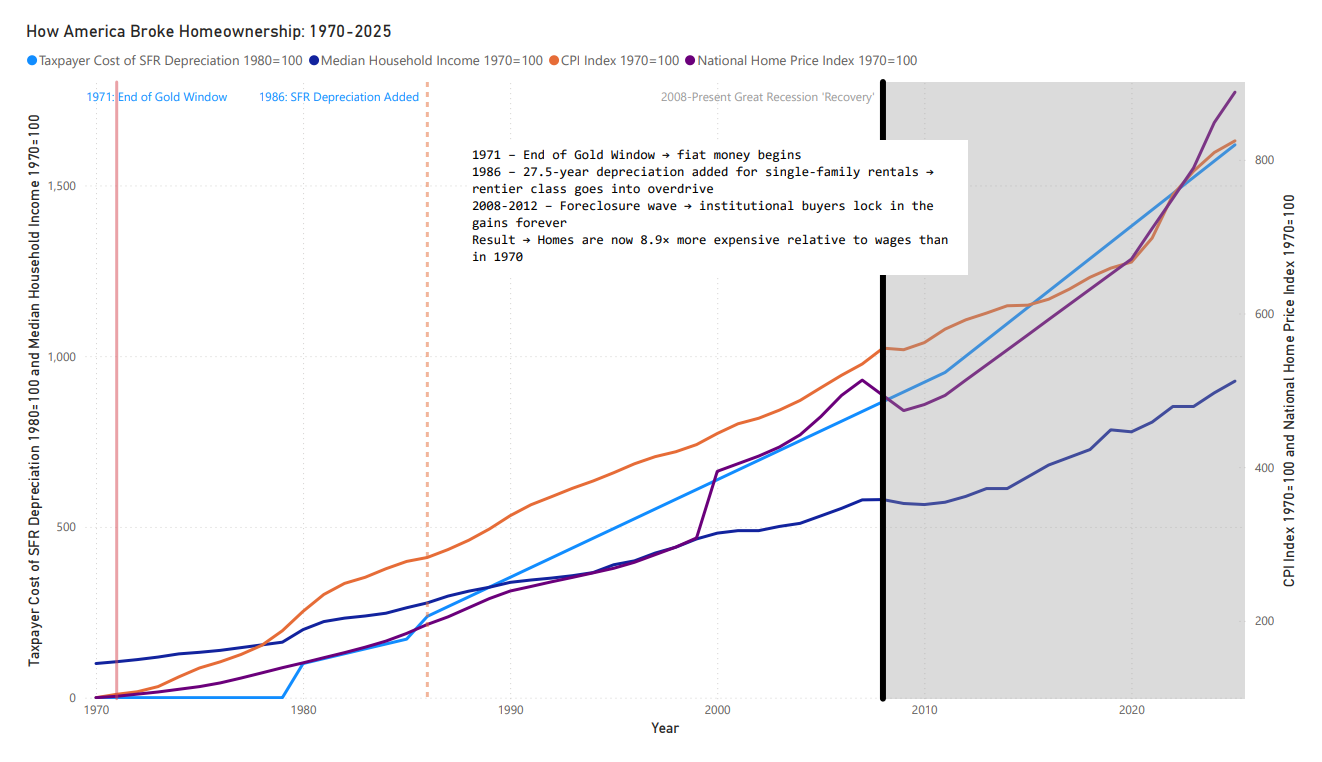
In 1986 to simplify tax filing for rental properties, Congress amended the tax code to allow for 27.5 year straight line depreciation on a single family home. This didn’t come into full effect until the “recovery” period. With an abundance of foreclosures and short sales on the market, savvy investors realized this tax loophole would work to their benefit. The Buy, Rehab, Rent, Refinance, Repeat (BRRRR) movement entered the mainstream.
Investors openly bragged that straight-line depreciation let them write off huge chunks annually without actual cash outlay – phantom deductions sheltering rental income. Almost overnight: Homes became investment vehicles as opposed to just being homes. A home today now costs about 8.9 times more than one cost in 1970. This was also fueled by near zero interest rates for a decade. Easy money, easy gains. So why can’t kids afford a home? Well that is a couple of the major pieces right there, and they were exacerbated in the fallout of the Great Recession.
Back Testing the APCA Model on 2008-2009:
In order to back test the model, I set parameters for moderate uptake and velocity at 5. Assuming uptake was 7.5% to include approximations of unbanked and underbanked Americans in today’s economy. Velocity in the model just symbolizes how that money flows through the economy. 2-3 would be appropriate for pessimistic economies, but the model allows for more aggressive analysis. I have tested the model at 15, and the model just scaled linearly. Velocity just dials in how much is being recaptured through APCAs reduced swipe fees as money is spent as normal by utilizing the Prosperity Card.
With those modest assumptions, economic conditions in 2008 could have been the following:
- Unemployment would likely have been ~.22% lower
- GDP growth would have been boosted by $63.7B
- National Debt added would have been reduced by $12.74B retired by recapture
- CPI would have been stabilized rather than turning deflationary
That is good, but it isn’t a magic bullet. I then modelled for a natural uptake rise to 17.5% as Americans would naturally seek out a safer asset in Treasury backed accounts. I’ve kept the velocity at 5, and the 2009 results could have been the following:
- Unemployment would likely have peaked at 8.79% vs. 9.3%
- GDP would have lifted 1.01% to $14.624T
- Another $29.1B in debt would have been retired by recapture
- CPI would have stabilized near 0% rather than entering deflation
The natural tendency seeking safer assets in uncertain conditions, provides feedback to the system allowing for more controlled response from the government if it became necessary at all. This doesn’t prevent the market driven causes, but having this backstop in place would definitely have made the Great Recession a lot more bearable. Broader uptake in modelling just makes the outcome more positive.
Simply recapturing and utilizing transaction fees among those with a higher MPC provides stability in an otherwise unstable environment. Feel free to run the model in whatever fun scenarios you can dream up. That is why I made it publicly available. A backstop like this does not currently exist in our system. As you can see it is vitally necessary.
Leave a Reply